ChartGpt
Create a data chart using plain text
Data analysis
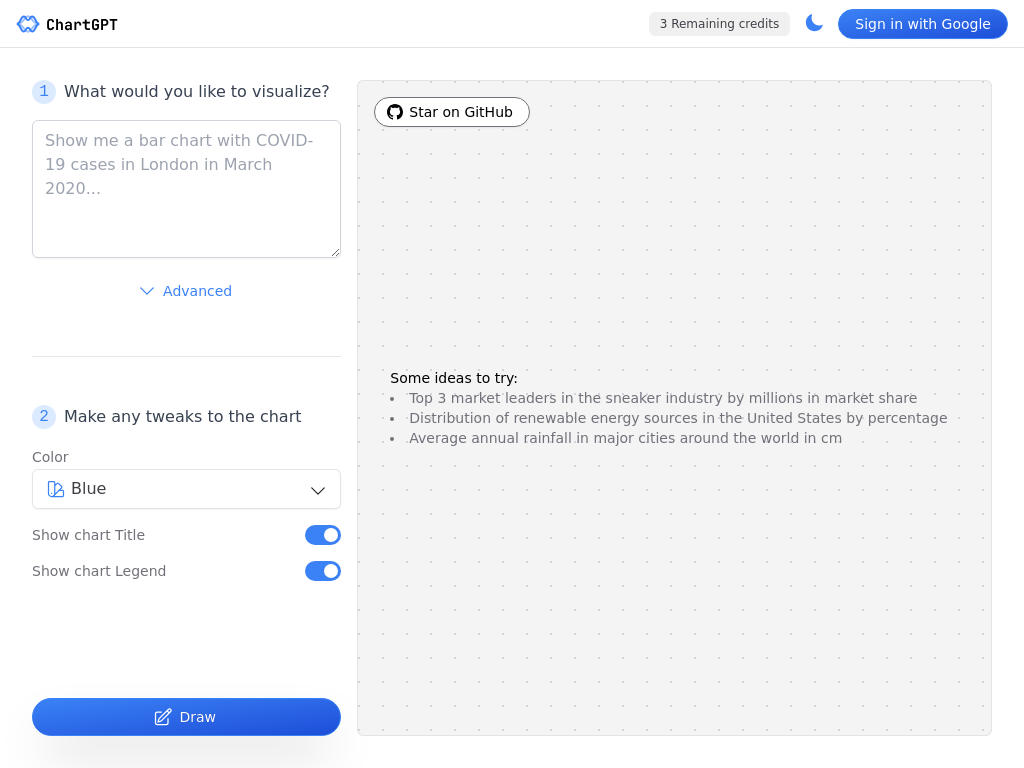
Text to chart
what is ChartGpt
Chartify is an AI tool that transforms text into easy-to-read visual representations like graphs and charts. It helps you analyze financial data and trends.
Open Source
👍🏻 Advantages
- Visualize data easily
- Customizable chart designs
- No coding required
😁 Disadvantages
- Limited chart customization
- May not support all data formats
- May not be free
💰 Plans and pricing
- Free
- $5 per 20 credits
- $20 for 100 credits
- $35 for 250 credits
- $80 for 750 credits
📺 Use cases
- Visualize data
- Create charts
- Customize design
👥 Target audience
- Marketers
- Business owners
- Students


